Spatio-Temporal Models of Distance Education
Coldeway’s Quadrants
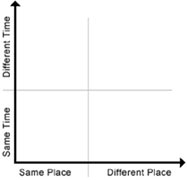
Dan Coldeway, while at Canada’s Athabasca University, developed the first place/time model of distance education systems (Simonson 2000). Distance learning has evolved considerably since then, but Coldeway’s framework is still a good high-level model of education delivery in a spatio-temporal context. Coldeway’s model is very straightforward. The dimensions of time and place are rendered along the vertical and horizontal axes of a two-dimensional graph. Only two values are indicated along each axis—same and different. Coldeway places all educational systems within one of four quadrants (see Fig. 1).

Fig 1. Coldeway’s Quadrants: the fundamental spatio-temporal framework.
The Same Time – Same Place quadrant represents traditional classroom education. Student(s) and instructor(s) gather at the same time and location. This is the “control” quadrant; any system in this quadrant is not considered a form of distance education.
The Different Time – Different Place quadrant represents the “purest” form of distance education—student(s) and instructor(s) engage in the educational activity at different times and in different places. Correspondence study is the classic example of Different Time – Different Place education. Prior to Coldeway’s framework, most discussions of distance education systems were restricted to this quadrant.
Coldeway’s model reveals a “gray area”—the Same Time – Different Place quadrant—representing synchronous distance education. Student(s) and instructor(s) gather at the same time, but in different places. One example is the live broadcast of a lecture to multiple classrooms. Another example is the use of Chat software to communication in real time via web-based educational systems.
Another “gray area” revealed by Coldeway is the Different Time – Same Place quadrant, representing education that occurs asynchronously at one location. Language labs and media centers are examples of Different Time – Same Place systems. Students come and go at different times, taking advantage of equipment, mentoring, or other services at a fixed location. Some would include multiple sessions of the same classroom instruction as a form of Different Time – Same Place education.
A New Model
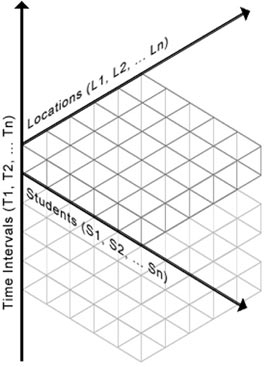
Coldeway’s model effectively introduces the concepts of time and place, and provides a guideline for understanding similarities and differences among distance education delivery systems. However, there are many spatio-temporal issues that require a more robust visual model. The author proposes two extensions to Coldeway’s design—a greater number of values along each axis, and an additional axis representing the number of students in the system (see Fig.2).

Fig 2. The author’s three-dimensional model: an extension of Coldeway’s framework.
The new model displays any number of temporal intervals. Even Same Time – Same Place education usually occurs not at one time, but at regular, scheduled intervals. When student(s) and instructor(s) participate at different times, it is often useful to know when, how often, and with what degree of regularity they participate.
The new model handles any number of locations. Instructors and instructional designers need to know how many sites are involved in a system, in order to effectively design and deliver instruction. Similarly, it is necessary to know how many students participate at each site. Delivery to two remote classrooms, each with 30 students, will differ significantly from delivery to 60 individuals studying at home. A matrix of locations and students provides a deeper representation of place than location alone.
At first glance, the author’s model may appear to differ significantly from Coldeway’s now classic framework. It is, however, a simple and logical extension. Most will agree that Coldeway’s same and different values must be extended to account for deeper differences among systems. And the notion of place is more accurately described when one acknowledges the number of students at each location.
Small Multiples
Edward Tufte, in his informative and visually stunning book Envisioning Information, describes the value of “small multiples” in data analysis (Tufte 1990):
- “At the heart of quantitative reasoning is a single question: Compared to what? Small multiple designs, multivariate and data bountiful, answer directly by visually enforcing comparisons of changes, of the differences among objects, of the scope of alternatives. For a wide range of problems in data presentation, small multiples are the best design solution.”
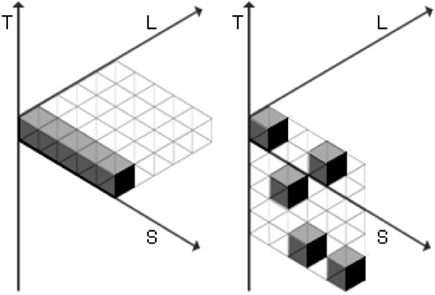
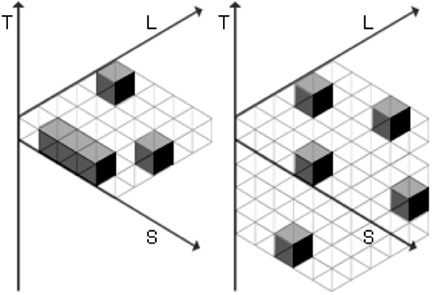
The author’s spatio-temporal model of educational systems lends itself to small multiple presentations (see Fig. 3,4). In miniature, the Time, Location and Student axes are represented by the letters T, L and S respectively. Quantities or Intervals along each axis are represented by shaded squares. Thus, shaded cubes form where time, location and student intersect. A “transparent” matrix visually situates data in a three-dimensional space.
Figure 3 illustrates two Same Place scenarios. The example on the left might represent an educational conference or workshop. The educational activity occurs at only one time interval and one physical location, with many students participating. This is clearly not a distance education scenario. The activity illustrated on the right also occurs at one location. However, various students come to the location at seemingly irregular intervals—sometimes alone and at other times in small groups. Perhaps this represents a “learning lab” conducted by teaching assistants.

Fig 3. Small multiples: two Same Place scenarios.
Figure 4 illustrates two Different Place scenarios. The example on the left illustrates a traditional classroom course that is also broadcast via educational television. At one location, several students participate, while individuals simultaneously watch from their homes. In contrast, the example on the right is asynchronous and not location-dependent. This is a “pure” distance education activity.

Fig 4. Small multiples: two Different Place scenarios
Concluding Remarks
The distinction between “traditional” and “distance” education is unclear and perhaps irrelevant. Many traditional systems are enhanced by distance technologies/methodologies, and vice versa. Synchronous and asynchronous systems are intertwined. Students converge at one location for group work, and then depart for individual activity. Instructors broadcast information to groups, and then follow up with individual student communications.
The author’s spatio-temporal model, presented in small multiples, provides a means of visualizing complex, interconnected educational activities. Various systems can be compared side-by-side, or one system can be represented as its “state” changes (for example, a shift from asynchronous to synchronous delivery). This form of analysis may reveal significant patterns that increase our understanding of educational activities, leading in turn to improvements in instructional design and delivery.
References
Simonson, Michael et al. Teaching and Learning at a Distance: Foundations of Distance Education. Upper Saddle River, New Jersey: Merrill, 2000. (Coldeway’s Quadrants discussed on pp.7-8).
Tufte, Edward E. Envisioning Information. Cheshire, Connecticut: Graphics Press, 1990. Small Multiples discussed on pp.67-79.
 Ronald Rice is a Web Designer specializing in eLearning systems. He can be reached at rajwarra@acm.org


