Planning and Managing Distance Education Systems: Applying system dynamics
Farhad Saba, Ph. D.
Founder and Editor, Distance-Educator.com
In this series of articles, I presented a hierarchical model of distance education consisting of seven interrelated nested systems levels. These systems have been present in most distance education organizations that I observed, or planned and built over the past 30 years. In the previous weeks, I discussed Hardware, Software, Telecommunications, Instructional, Educational, Societal and Global Systems Levels. Last week I started to explain the process of system modeling so that you could start the planning process for your organization. I hope that conducting the environmental scan as presented in a previous article has given you a better appreciation of the components of the technology-based educational programs in your organization and the interrelationships among such components. But before we go any further on the process of modeling itself, certain important concepts in system methodology must be explained in the following as a follow up to this previous article about system methodology.
Saba and Twitchell (1988) were concerned with the viability of distance education programs as educational television was becoming interactive in the 1980s in the sense that students could use a phone to call the instructor who was presenting in a television studio and ask questions or comment about the subject being taught. There was also the specter of digital telecommunication, which promised making courses highly interactive
Forrester (1961) offered a systematic approach to implementation of system dynamics, and the related design process that is necessary for planning and modeling for an organization. His approach included the following:
- Identify a problem
- Isolate the factors that appear to interact to create the observed symptoms.
- Trace the cause-and-effect information-feedback loops that link decisions to action to resulting information changes and to new decisions.
- Formulate acceptable formal decision policies that describe how decisions result from the available information streams.
- Construct a mathematical model of the decision policies, information sources, and interactions of the system components.
- Generate the behavior through time of the system as described by the model (usually with a digital computer to execute the lengthy calculations).
- Compare results against all pertinent available knowledge about the actual system.
- Revise the model until it is acceptable as a representation of the actual system.
- Redesign, within the model, the organizational relationships and policies which can be altered in the actual system to find the changes which improve system behavior.
- Alter the real system in the directions that model experimentation has shown will lead to improved performance. (pp. 13-14)
Identifying a problem: Saba and Twitchell (1988) were concerned with the viability of distance education programs as educational television was becoming interactive in the 1980s in the sense that students could use a phone to call the instructor who was presenting in a television studio and ask questions or comment about the subject being taught. There was also the specter of digital telecommunication, which promised making courses highly interactive (See Saba, & Twitchell’s 1988a and 1998b articles on the use of integrated services digital networks in distance education). The question, therefore, was what would be an optimal number of students which would make a distance education system viable when a smaller number of students could be accommodated in each course due the nature of interactivity as compared to previous models of educational television in which much larger numbers of students were present since these models were based on a one-way presentation of information from the instructor to the learner.
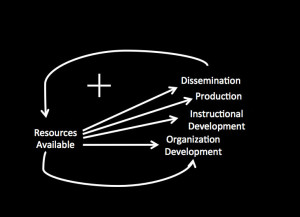
Isolating the factors that appeared to interact to create the observed symptoms- The researchers selected the components for this simple model from a study conducted by Hawkridge and Robinson (1982) who observed twelve educational broadcasting organizations in Africa, Asia and Europe as well as in North and South America. In all of these organizations five interrelated components were present:
- Resources in terms of money to support the activities of the educational television organization. These resources were spent on at least four activities that were common among the systems studied by Hawkridge and Robinson (1982):
- Organizational development to ensure that personnel were moving the organization towards its stated goals
- Instructional development that was needed for developing courses and programs to be televised
- Production of instructional materials in the form of television programs and supplementary print materials
- Dissemination of television programs through the airwaves, cable systems, or satellites, and/or on videotape as well as distribution of the supplementary print materials.
…educational institutions expected a windfall profit in the early 1990s as they began to make courses available on the Internet.
The hypothesis of simulation project (symptom/problem) was related to an anticipated issue in terms of the degree to which smaller student populations in a distance education system would be able to support an institution; a problem that is now prevalent throughout the higher education institutions as they are trying to understand the economics of presenting courses to a relatively small number of students in each course on the Internet, the emerging concept of MOOCs not withstanding. In other words, educational institutions expected a windfall profit in the early 1990s as they began to make courses available on the Internet. Not only such profits did not materialize, it became clear that despite the small cost of distributing a course digitally as compared to course distribution via analog media, there were costs associated with instructional design and faculty support (organization development) among other expenses that must be taken into consideration in calculating the benefits and costs of distance education systems.
Trace the cause-and-effect information-feedback loops that link decisions to action to resulting information changes and to new decisions. The five selected components were presented in the following causal loop diagram in Figure 1.

Figure 1- Causal loop diagram of a simple model of a distance education system adapted from Saba, and Twitchell 1988.
In creating the causal loop diagram Forrester’s guidelines that are paraphrased below were taken into consideration. These guidelines required that:
1- The causal loop diagram include all the necessary components that would describe the system adequately
2- Components be named in common terminology of the field (i.e. educational broadcasting in this instance) so that everyone concerned with the planning and modeling process could readily recognize the components
3- The diagram depict the cause-effect relationships among the components
4- The diagram would lead to explaining a simple mathematical explanation of the cause-effect relationships
5- The model would be extendable to include other components and cause-effect relationships.
6- Interaction among components be continuous, however, discontinuous interactions necessary to account for decision/solution time intervals would bot affect the outcome of the simulation. (Forrester 1961 Page 67).
REFERENCES
Forrester, J. W. (1961). Industrial dynamics. Waltham, MA: Pegasus Communications
Hawkridge, D., and Robinson, J. (1982). Organizing Educational Broadcasting. London: Croom Helm.
Saba, F. ,& Twitchell, D. (1988a). Research in distance education: A system modeling approach. American Journal of Distance Education, 2(1), 9-24.
Saba, F. ,& Twitchell, D. (1988b). Integrated services digital networks: How it can be used for distance education. Journal of Educational Technology Systems, 17(1), 15-25.


